Qtum expanding blockchain limits and 2018 forecast
Reuniting the best of Bitcoin core, Proof-of-Stake Consensus, and an Account Abstraction Layer in order to manage several Virtual Machines, including the Ethereum one (EVM), Qtum Foundation releases the Qtum open source project: a hybrid application platform.
Developers will benefit with this project having a better, diversified and a solid programming environment, able to run applications on multiple platforms and make smart contracts, managing in leisurely way companies and other institutions with this technology.
The Account Abstract Layer gives us the advantage of using it as a communication interface between Unspent Transaction Output model of Bitcoin Core and the EVM. Also, Datafeed feature and Oracles will help developers in the creation of the smart contracts mentioned before.
Also, we have good news: Public blockchain via Qtum Foundation’s programmers will allow us to use Qtum in order to manage industries like Manufacturing, Finances, Mobile Telecommunications, Industrial Logistics, Counterfeit Protection and many others, adapting itself to the demanding business dynamics of these days.
Qtum 2018 price forecast
In order to simplify this forecast, we’ll use the essential Forex technical analysis concepts to explain you the behavior of some cryptocurrencies on 2017 and why Qtum coin could react like these ones. Not only we have to investigate and learn about cryptocurrencies investments, also we have to act in the right moment, and if we move our pieces on the board in the best way, we’ll start to diversify our financial resources; we’ll step into the future.
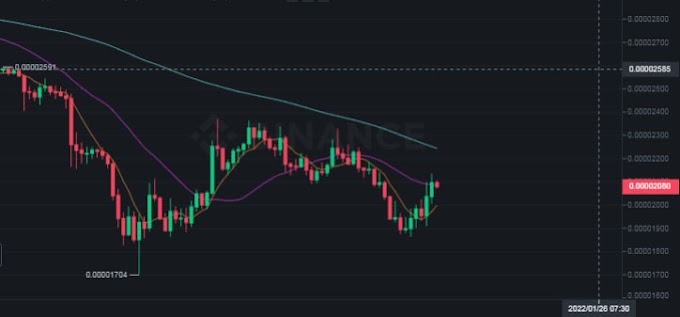
Recently, from August to 13th December 2017, the price behavior of Qtum (according to technical analysis graphics) describes a ‘symmetrical triangle’. Let’s remember the moment right after Qtum ICO; the lows in August were $5.06 but in the same month we have a high of $21.76, now then, that symmetrical triangle means that the higher lows and lower highs were the most important feature of Qtum coin. Now we’ll take a look at what implies those lows and highs.
Like compressing a spring, the symmetrical triangle pattern keeps a lot of energy between those lows, highs and support and resistance lines, we could call that energy ‘price’; that is stored in that compression that implies the contraction of the range between support line and resistance line. A break could occur like a fall below support or arise over resistance, so, we have to pay attention to a quick and powerful move in Qtum price for this year.
Let’s unfold some recent events on the table: Beginning 2017, several patterns observed in some cryptocurrencies evolved into a rapid and powerful move, and later, prices rise occurred. We have to consider the enthusiasm and confidence on Qtum like a good alternative not only for cryptocurrencies exchange. Lower prices could follow recent close below $8, while a close over $15 a higher price for Qtum coin in the next months.
But a forecast couldn’t be complete if we don’t give some suggestions about staking with Qtum and other strategies for consideration if we want to make good investments, especially with all potential applications that this open source code project has to offer.


0 Comments