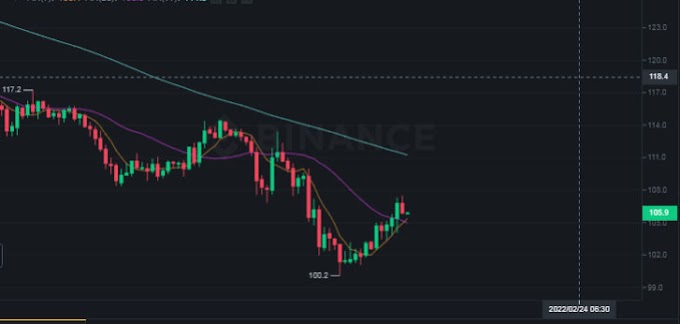
After ensuring the five-month support at $0.076-mark, VET finally let go of its long-term bearish trend resistance (since 9 November, white).
This retrieval attempt marked a rising wedge (green, reversal pattern) on its 4-hour chart. However, the price action found $0.100-mark as resistance since the beginning of this month.
As a result, it saw a 20.37% breakdown from 27 to 30 December. Over the past three days, VET found an oscillating range between $0.08783 and $0.08157-mark.
At press time, the alt traded at $0.08699. Since 30 December, the RSI was northbound as it recovered from the oversold region. The MACD histogram depicted an increasing buying pressure. But its lines were still under the equilibrium. Besides, the Volume Oscillator marked lower peaks and displayed a weak bullish move. Now, the immediate testing point for the bulls stood at $0.087-mark.


0 Comments