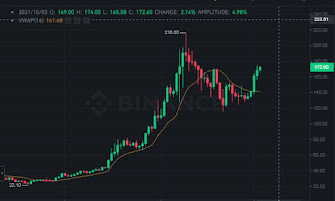
Solana's price slid into consolidation from September 21 to September 31, forming a symmetrical triangle pattern. A spike in bullish momentum led to a breakout, pushing SOL by 23%. However, the altcoin can go higher, but it needs to clear a crucial resistance barrier.
Solana price set up two lower highs and three higher lows since September 21. Connecting these swing points using trend lines shows the formation of a symmetrical triangle pattern. This technical formation forecasts a 24% breakout, determined by measuring the distance between the first swing high and swing low.
On October 1, Solana's price sliced through the upper trend line at $143.95, leading to a breakout. Since then, SOL has rallied through the $150.34 and $170.73 resistance barriers. However, it did not hit the intended target at $79.43.
AS Solana price currently consolidates above this support floor, the Momentum Reversal Indicator (MRI) flashed a red ’one’ sell signal on the six-hour chart.
This technical formation forecasts a one-to-four candlestick correction. While Solana price has already created one red six-hour candlestick, it is unsure if the downswing is over.
If SOL manages to produce a decisive close above $188.20, it will open a resistance-free path for Solana's price to retest the all-time high at $216.91.
While things are on the fence for Solana's price, a breakdown below $170.73 will confirm that the investors are booking profits.
In such a case, the SOL price will likely retrace to $150 before giving the uptrend another go. However, a breach below this support floor will invalidate the bullish thesis.
XRP price prepares for second leg-up
Shiba Inu price moves higher to test key resistance at $0.0000077


0 Comments