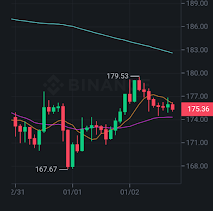
The inverse head and shoulder breakout halted at the month-long resistance near the $203-mark. Since then, SOL retraced by over 18.5% until it poked its two-week low on 31 December.
After losing the 23.6%, 38.2% Fibonacci supports, the price action fell below its Point of Control (red) at the $180-level. Further, the falling wedge breakout came to rest at the above level that acted as immediate resistance.
Regardless of the pullout, the bulls have ensured the 61.8% Fibonacci support near the $167-level for a while now.
At press time, the alt traded at 175.85. The RSI was just below the midline after failing to sustain itself above the 50-mark. Also, the DMI showed a bearish vigor. However, Squeeze Momentum Indicator flashed a low volatility phase.


0 Comments